
The Vanguard Diversified Growth Index ETF (VDGR) is a popular investment option for those seeking a diversified portfolio with a focus on long-term capital growth. As an exchange-traded fund (ETF) listed on the Australian Securities Exchange (ASX) under the code VDGR, this ETF offers exposure to a mix of growth and income-producing assets. This combination makes it an attractive choice for investors who want to balance potential returns with manageable risk.
What is VDGR?
Launched on November 20, 2017, VDGR has since grown significantly, reflecting its robust investment strategy and appealing benefits. The ETF aims to track the weighted average return of various indices of the underlying funds in which it invests before accounting for fees, expenses, and taxes. This strategy ensures that investors benefit from a diversified portfolio, reducing the risk associated with investing in individual assets.
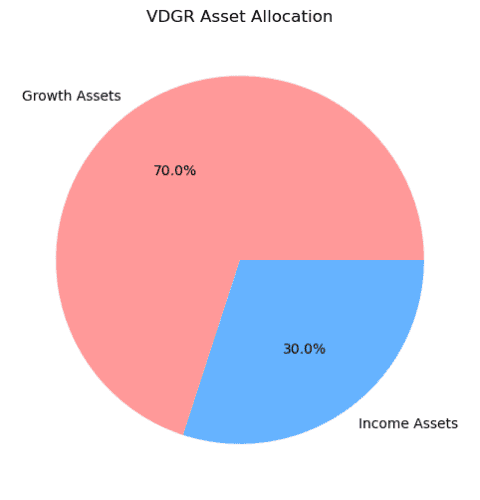
VDGR allocates 70% of its assets to growth investments, such as shares, and 30% to income-producing investments, like bonds. This strategic asset allocation (SAA) is designed to provide a balanced approach, offering the potential for capital appreciation while also generating income. The fund’s mix of asset classes helps in managing volatility and enhances the likelihood of achieving long-term financial goals.
Why Choose VDGR?
VDGR provides low-cost access to a professionally managed mix of investments, tailored to align with an investor’s risk profile. Its diversified nature means it includes over 16,000 securities, offering broad exposure across different sectors and regions. This diversification is key to spreading risk and reducing the impact of any single investment’s poor performance.
Additionally, VDGR benefits from Vanguard’s expert rebalancing. This process ensures that the fund’s asset allocation remains in line with its strategic targets, automatically adjusting for market movements. This hands-off approach makes VDGR an ideal option for investors who prefer a “set and forget” strategy, trusting their investment to professional management.
Key Features
- ASX Code: VDGR
- Inception Date: November 20, 2017
- Fund Size: $801.2 million
- Management Fee: 0.27% p.a.
- Distribution Frequency: Quarterly
- Base Currency: AUD
Strategic Asset Allocation
VDGR’s asset allocation is divided into growth and income assets, reflecting its balanced investment approach:
| Asset Class | Allocation |
|---|---|
| Growth Assets | 70% |
| Income Assets | 30% |
This allocation supports the ETF’s objective of long-term capital growth while providing some income stability. The growth assets include domestic and international shares, while the income assets consist of bonds and fixed interest investments. This mix is suitable for investors with a higher tolerance for risk, aiming to achieve substantial growth over time.
Fund Objective and Strategy
The primary objective of the Vanguard Diversified Growth Index ETF (VDGR) is to provide investors with long-term capital growth by tracking the weighted average return of various indices of the underlying funds in which it invests. This approach ensures that the ETF mirrors the performance of a broad and diversified mix of asset classes, allowing investors to benefit from the growth potential of different sectors and regions.
Objective
VDGR seeks to replicate the performance of its benchmark, the Growth Composite Index, before taking into account fees, expenses, and taxes. The Growth Composite Index is a weighted blend of multiple indices, representing the various asset classes in which VDGR invests. By following this benchmark, VDGR aims to deliver consistent returns that align with the performance of global markets.
Strategy
VDGR employs a strategic asset allocation (SAA) model to maintain a balanced mix of growth and income-producing assets. The ETF allocates approximately 70% of its portfolio to growth assets, such as equities, and 30% to income assets, including bonds and fixed interest investments. This allocation is designed to achieve a balance between capital appreciation and income generation, providing investors with a stable yet growth-oriented investment option.
Growth Assets (70%)
- Domestic Shares: VDGR invests a significant portion of its assets in the Vanguard Australian Shares Index Fund. This fund tracks the performance of the S&P/ASX 300 Index, providing broad exposure to the Australian equity market.
- International Shares: The ETF also invests in the Vanguard International Shares Index Fund and the Vanguard International Shares Index Fund Hedged. These funds track the performance of the MSCI World ex-Australia Index, offering exposure to global equity markets outside Australia.
- Small Companies and Emerging Markets: To enhance growth potential, VDGR includes allocations to the Vanguard International Small Companies Index Fund and the Vanguard Emerging Markets Shares Index Fund. These funds focus on smaller companies and emerging markets, respectively, adding diversity and potential for higher returns.
Income Assets (30%)
- Global Bonds: A portion of VDGR’s portfolio is allocated to the Vanguard Global Aggregate Bond Index Fund Hedged. This fund tracks the Bloomberg Barclays Global Aggregate Float-Adjusted and Scaled Index, providing exposure to international fixed income markets.
- Domestic Fixed Interest: VDGR also invests in the Vanguard Australian Fixed Interest Index Fund, which tracks the Bloomberg AusBond Composite 0+ Yr Index. This fund provides exposure to the Australian fixed interest market, adding stability to the portfolio.
Rebalancing and Management
VDGR benefits from Vanguard’s expert management and rebalancing strategies. Vanguard continuously monitors the ETF’s asset allocation, making adjustments as needed to ensure it remains aligned with the target allocation of 70% growth assets and 30% income assets. This rebalancing helps maintain the intended risk-return profile, ensuring that investors receive consistent performance over time.
Benefits of VDGR’s Strategy
- Diversification: By investing in a wide range of asset classes, VDGR reduces the risk associated with individual investments. This diversification helps to smooth out returns and mitigate the impact of market volatility.
- Professional Management: Vanguard’s experienced investment team manages VDGR, leveraging their expertise to optimize the fund’s performance and ensure it adheres to its strategic asset allocation.
- Cost Efficiency: With a management fee of just 0.27% p.a., VDGR offers a low-cost way to gain exposure to a diversified portfolio. This cost efficiency allows investors to retain more of their returns.
- Long-term Growth: The focus on growth assets aims to provide substantial capital appreciation over time, making VDGR suitable for investors with a long-term investment horizon.
Key Facts and Figures
| Key Facts | Details |
|---|---|
| ASX Code | VDGR |
| Inception Date | November 20, 2017 |
| Fund Size | $801.2 million |
| Management Fee | 0.27% p.a. |
| Distribution Frequency | Quarterly |
| Base Currency | AUD |
| Fund Taxation Election | AMIT |
| Benchmark | Growth Composite Index |
Fund Overview
The Vanguard Diversified Growth Index ETF (VDGR) is designed to provide investors with a low-cost, diversified portfolio. This ETF includes a mix of sector funds, focusing on both growth and income assets. VDGR’s strategic asset allocation ensures a balanced approach, aiming for long-term capital growth while managing risk through diversification.
Asset Allocation
VDGR’s portfolio is divided into two main categories:
| Asset Class | Allocation |
|---|---|
| Growth Assets | 70% |
| Income Assets | 30% |
This allocation strategy supports the fund’s objective of capital appreciation and income generation. By maintaining a higher proportion of growth assets, VDGR aims to capture market gains, while the income assets provide stability and regular income.
Holdings and Allocation
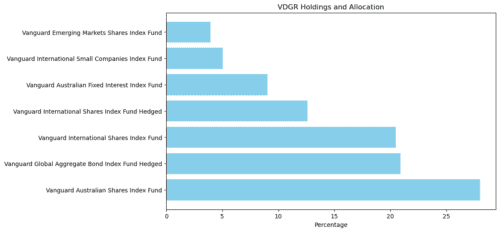
VDGR achieves its strategic asset allocation by investing in several underlying Vanguard funds. Each of these funds contributes to the overall diversification and performance of VDGR. Here is a detailed breakdown of the underlying holdings:
| Fund | Percentage |
|---|---|
| Vanguard Australian Shares Index Fund | 28.02% |
| Vanguard Global Aggregate Bond Index Fund Hedged | 20.92% |
| Vanguard International Shares Index Fund | 20.48% |
| Vanguard International Shares Index Fund Hedged | 12.59% |
| Vanguard Australian Fixed Interest Index Fund | 9.02% |
| Vanguard International Small Companies Index Fund | 5.03% |
| Vanguard Emerging Markets Shares Index Fund | 3.93% |
Performance Overview
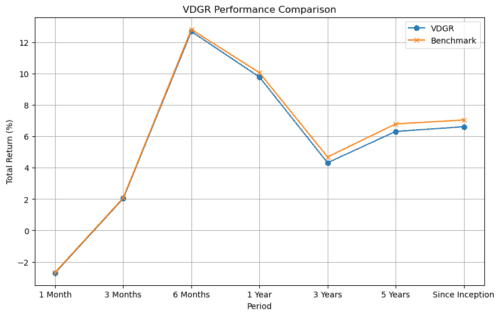
The Vanguard Diversified Growth Index ETF (VDGR) has demonstrated solid performance since its inception in November 2017. The returns have varied across different periods, reflecting the ETF’s ability to adapt to market conditions and maintain a balanced portfolio. Below is a detailed performance summary of VDGR compared to its benchmark.
| Period | Total Return (%) | Benchmark Return (%) |
|---|---|---|
| 1 month | -2.71 | -2.67 |
| 3 months | 2.04 | 2.08 |
| 6 months | 12.70 | 12.83 |
| 1 year | 9.79 | 10.07 |
| 3 years (p.a.) | 4.32 | 4.69 |
| 5 years (p.a.) | 6.32 | 6.80 |
| Since inception (p.a.) | 6.62 | 7.05 |
Detailed Performance Analysis
- 1 Month (-2.71% vs. -2.67%): In the short term, VDGR experienced a slight decline, closely mirroring its benchmark. This minor negative performance can be attributed to short-term market volatility, which affects both the ETF and its benchmark similarly.
- 3 Months (2.04% vs. 2.08%): Over a three-month period, VDGR showed positive returns, indicating its ability to recover from short-term downturns. The performance was slightly lower than the benchmark, but still within a close range.
- 6 Months (12.70% vs. 12.83%): The six-month performance of VDGR reflects strong growth, closely aligned with the benchmark. This period likely benefited from favorable market conditions and effective asset allocation within the ETF.
- 1 Year (9.79% vs. 10.07%): Over the past year, VDGR achieved nearly double-digit returns, demonstrating its potential for growth. The performance is slightly below the benchmark, but still showcases the ETF’s robust growth capabilities.
- 3 Years (p.a.) (4.32% vs. 4.69%): On an annualized basis over three years, VDGR maintained steady growth, though slightly trailing its benchmark. This consistency highlights the ETF’s ability to provide reasonable returns over medium-term periods.
- 5 Years (p.a.) (6.32% vs. 6.80%): The five-year annualized returns show that VDGR has delivered solid growth, closely following the benchmark. The performance indicates that the ETF is effective in its strategy of balancing growth and income assets.
- Since Inception (p.a.) (6.62% vs. 7.05%): Since its inception, VDGR has provided an annualized return of 6.62%, just slightly below its benchmark. This long-term performance demonstrates the ETF’s capability to generate consistent returns, making it a reliable option for long-term investors.
Understanding the Returns
The performance of VDGR is measured by the total return, which includes both capital appreciation and income distributions. The benchmark used for comparison is the Growth Composite Index, which reflects the performance of a similar diversified portfolio of growth and income assets.
VDGR’s returns are after fees, meaning they represent the net gain for investors after accounting for the ETF’s management fee of 0.27% per annum. This makes the performance figures a realistic reflection of what investors can expect to earn.
Key Takeaways
- Consistent Performance: VDGR has shown consistent performance across various periods, closely tracking its benchmark. This consistency is crucial for investors seeking steady long-term growth.
- Low Tracking Error: The small differences between VDGR’s returns and the benchmark indicate a low tracking error, suggesting that the ETF effectively mirrors the performance of its target index.
- Balanced Growth: The ETF’s strategic asset allocation of 70% growth assets and 30% income assets has enabled it to achieve a balance between capital appreciation and income generation, catering to investors with a moderate risk tolerance.
VDGR Distributions
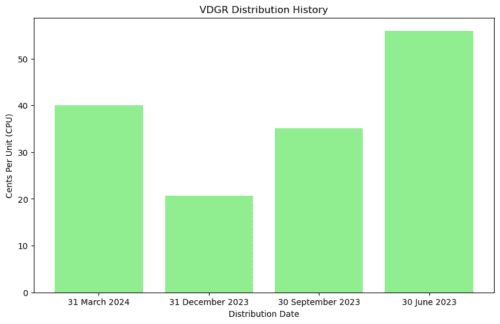
The Vanguard Diversified Growth Index ETF (VDGR) distributes income to its investors on a quarterly basis. These distributions are derived from the income generated by the underlying assets in the ETF, including dividends from shares and interest from bonds. Investors can choose to receive these distributions as cash payments or reinvest them to purchase additional units of the ETF, thus compounding their investment.
Here is a table showing the recent distribution data:
| Distribution Date | Cents Per Unit (CPU) | Reinvestment Price (AUD) |
|---|---|---|
| 31 March 2024 | 40.0565 | $59.5407 |
| 31 December 2023 | 20.7403 | $56.4243 |
| 30 September 2023 | 35.1183 | $53.1595 |
| 30 June 2023 | 55.9580 | $54.2365 |
Explanation of Recent Distributions
- 31 March 2024: The distribution for this quarter was 40.0565 CPU, with a reinvestment price of $59.5407 per unit. This higher distribution indicates strong income generation from the ETF’s underlying assets during this period.
- 31 December 2023: The distribution for the end of the year was 20.7403 CPU, with a reinvestment price of $56.4243 per unit. This slightly lower distribution compared to the previous quarter reflects seasonal variations in income.
- 30 September 2023: The third quarter saw a distribution of 35.1183 CPU, with a reinvestment price of $53.1595 per unit. This distribution is moderate and reflects steady income from the ETF’s holdings.
- 30 June 2023: The distribution at mid-year was 55.9580 CPU, with a reinvestment price of $54.2365 per unit. This higher distribution can be attributed to strong income performance, possibly boosted by dividends and interest payments.
VDGR Distributions
The Vanguard Diversified Growth Index ETF (VDGR) distributes income to its investors on a quarterly basis. These distributions are derived from the income generated by the underlying assets in the ETF, including dividends from shares and interest from bonds. Investors can choose to receive these distributions as cash payments or reinvest them to purchase additional units of the ETF, thus compounding their investment.
Here is a table showing the recent distribution data:
| Distribution Date | Cents Per Unit (CPU) | Reinvestment Price (AUD) |
|---|---|---|
| 31 March 2024 | 40.0565 | $59.5407 |
| 31 December 2023 | 20.7403 | $56.4243 |
| 30 September 2023 | 35.1183 | $53.1595 |
| 30 June 2023 | 55.9580 | $54.2365 |
Explanation of Recent Distributions
- 31 March 2024: The distribution for this quarter was 40.0565 CPU, with a reinvestment price of $59.5407 per unit. This higher distribution indicates strong income generation from the ETF’s underlying assets during this period.
- 31 December 2023: The distribution for the end of the year was 20.7403 CPU, with a reinvestment price of $56.4243 per unit. This slightly lower distribution compared to the previous quarter reflects seasonal variations in income.
- 30 September 2023: The third quarter saw a distribution of 35.1183 CPU, with a reinvestment price of $53.1595 per unit. This distribution is moderate and reflects steady income from the ETF’s holdings.
- 30 June 2023: The distribution at mid-year was 55.9580 CPU, with a reinvestment price of $54.2365 per unit. This higher distribution can be attributed to strong income performance, possibly boosted by dividends and interest payments.
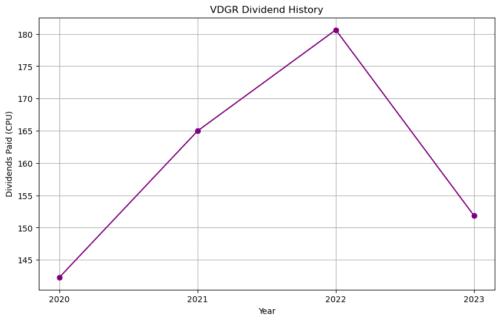
VDGR Dividend History
The historical dividend payments provide insight into the income-generating capability of VDGR over the years. Consistent and growing dividend payments are a positive indicator for investors seeking regular income from their investments.
Here is a summary of VDGR’s historical dividend payments:
| Year | Dividends Paid (CPU) |
|---|---|
| 2023 | 151.872 |
| 2022 | 180.632 |
| 2021 | 164.987 |
| 2020 | 142.312 |
Analysis of Dividend History
- 2023 (151.872 CPU): The total dividends paid in 2023 amounted to 151.872 CPU. This figure indicates a robust income distribution, reflecting the ETF’s strong performance and effective asset management.
- 2022 (180.632 CPU): In 2022, VDGR distributed a total of 180.632 CPU. This was a peak year for dividends, showcasing exceptional income generation from the ETF’s underlying assets.
- 2021 (164.987 CPU): The dividends paid in 2021 totaled 164.987 CPU. This stable income level suggests that the ETF maintained a strong income-generating performance despite market fluctuations.
- 2020 (142.312 CPU): In 2020, VDGR distributed 142.312 CPU. This year marked a solid performance amid global economic uncertainties, highlighting the resilience of the ETF’s diversified portfolio.
Benefits of VDGR Distributions
- Regular Income: Quarterly distributions provide investors with a steady stream of income, which can be particularly beneficial for those seeking regular cash flow.
- Reinvestment Options: Investors have the flexibility to reinvest their distributions, allowing them to compound their investment over time and potentially enhance their long-term returns.
- Transparency: The regular distribution schedule and clear reporting of CPU and reinvestment prices ensure transparency, helping investors make informed decisions.
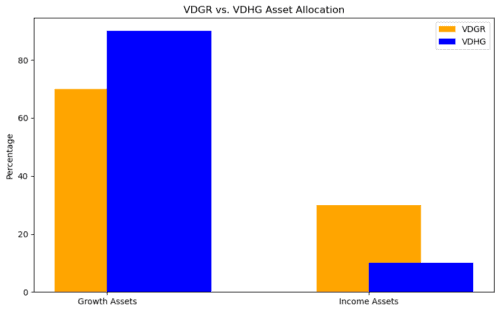
VDGR vs. VDHG
The Vanguard Diversified Growth Index ETF (VDGR) and the Vanguard Diversified High Growth Index ETF (VDHG) are both popular choices among investors looking for diversified portfolios managed by Vanguard. While they share some similarities, they are designed to cater to different investor profiles based on their risk tolerance and investment goals. Here is a detailed comparison of VDGR and VDHG:
Key Differences
| Attribute | VDGR | VDHG |
|---|---|---|
| Growth Assets | 70% | 90% |
| Income Assets | 30% | 10% |
| Risk Level | Moderate to High | High |
| Suitable for | Investors seeking balanced growth | Investors seeking higher growth |
Asset Allocation
VDGR:
- Growth Assets (70%): VDGR allocates 70% of its portfolio to growth assets such as domestic and international shares. This allocation aims to provide significant capital appreciation over the long term.
- Income Assets (30%): The remaining 30% is allocated to income-producing assets like bonds and fixed interest investments, which offer stability and regular income.
VDHG:
- Growth Assets (90%): VDHG has a higher allocation to growth assets at 90%, emphasizing potential capital growth. This allocation includes a broad range of equities from both domestic and international markets.
- Income Assets (10%): Only 10% of VDHG’s portfolio is dedicated to income assets, making it more exposed to market fluctuations but with higher growth potential.
Risk Level
VDGR: The risk level for VDGR is categorized as moderate to high. The balanced approach of 70% growth and 30% income assets helps in managing risk while still aiming for substantial growth. This makes VDGR suitable for investors who are comfortable with some level of market volatility but prefer a degree of stability from income assets.
VDHG: VDHG is designed for investors with a higher risk tolerance. With 90% of its portfolio in growth assets, VDHG is more susceptible to market volatility, but it also offers greater potential for high returns. This ETF is ideal for investors who are focused on maximizing capital growth and can endure significant fluctuations in their investment value.
Suitability for Investors
VDGR:
- Balanced Growth: VDGR is suitable for investors seeking a balanced approach between growth and income. It is ideal for those who want to achieve long-term capital appreciation while also receiving regular income.
- Moderate Risk Tolerance: Investors who are willing to accept moderate to high risk in exchange for potential growth, but still prefer some stability, will find VDGR an appropriate choice.
VDHG:
- Higher Growth Potential: VDHG is targeted at investors who prioritize higher growth potential and are willing to take on greater risk. The high allocation to growth assets makes it suitable for those aiming to maximize their returns over the long term.
- High Risk Tolerance: This ETF is best for investors who can tolerate high levels of market volatility and are focused on long-term capital growth rather than income stability.
Comparative Performance
While both ETFs are managed by Vanguard and follow similar principles of diversification and low-cost investment, their performance will vary due to the difference in asset allocation. Historically, higher growth assets tend to yield higher returns over the long term but come with increased risk. VDGR, with its more balanced allocation, may provide steadier returns with less volatility, whereas VDHG is likely to experience more significant fluctuations but potentially higher overall growth.
Risk and Volatility
Understanding the risk and volatility of an investment is crucial for making informed decisions. VDGR has a beta of 1.00 and a standard deviation of 9.79%, indicating a moderate level of risk and volatility. These metrics are essential in helping investors gauge the potential fluctuations in the ETF’s value.
Beta
- Definition: Beta is a measure of an asset’s volatility in relation to the overall market. A beta of 1.00 indicates that VDGR’s price movements are in line with the market. This means that if the market increases or decreases by 1%, VDGR’s value is also expected to increase or decrease by 1%.
- Implication: A beta of 1.00 suggests that VDGR is neither more nor less volatile than the market. This makes it suitable for investors who want to match market performance without taking on additional risk.
Standard Deviation
- Definition: Standard deviation measures the amount of variation or dispersion of a set of values. In the context of VDGR, a standard deviation of 9.79% indicates the extent to which the ETF’s returns can deviate from its average return.
- Implication: A standard deviation of 9.79% suggests moderate volatility. This level of volatility is expected in a fund with a substantial allocation to growth assets. Investors should be prepared for periodic fluctuations in the value of their investment.
By understanding these metrics, investors can better assess whether VDGR aligns with their risk tolerance and investment goals.
Suitability for Investors
VDGR is tailored for investors seeking long-term capital growth and who are comfortable with a moderate to high level of risk. Here’s a closer look at who might find VDGR suitable:
Long-term Capital Growth
- Objective: VDGR aims to provide significant capital appreciation over the long term. This makes it ideal for investors with a time horizon of at least five to ten years.
- Growth Assets: With 70% allocated to growth assets, VDGR offers the potential for substantial gains, making it attractive for those looking to grow their wealth over time.
Buy-and-Hold Strategy
- Investment Approach: VDGR is designed for buy-and-hold investors who prefer to maintain their investment over an extended period rather than engage in frequent trading.
- Benefits: This strategy reduces transaction costs and allows the investment to benefit from the compounding of returns.
Risk Tolerance
- Moderate to High Risk: VDGR’s allocation to growth assets implies a higher risk level compared to more conservative investments. It is suitable for investors who are willing to accept the possibility of short-term losses for the potential of long-term gains.
- Market Volatility: Investors comfortable with market volatility will appreciate VDGR’s balanced approach, which includes income assets to provide some stability.
Fees and Costs
VDGR is known for its cost-efficiency, which is a significant advantage for long-term investors. Here’s a detailed breakdown of the fees and costs associated with VDGR:
| Fee Type | Amount |
|---|---|
| Management Fee | 0.27% p.a. |
| Indirect Costs | 0.00% p.a. |
| Net Transaction Cost | 0.00% p.a. |
| Brokerage Fee (Vanguard Personal Investor Account) | $0 when purchasing, $9 when selling |
Management Fee
- Description: The management fee is an annual charge expressed as a percentage of the fund’s net asset value. VDGR’s management fee is 0.27% per annum.
- Implication: This fee is relatively low compared to many actively managed funds, making VDGR an affordable option for investors looking to minimize costs.
Indirect Costs
- Description: Indirect costs are any additional costs incurred by the fund that are not included in the management fee. For VDGR, these costs are 0.00% per annum.
- Implication: The absence of indirect costs further enhances the cost-effectiveness of investing in VDGR.
Net Transaction Cost
- Description: Net transaction costs include expenses related to buying and selling the underlying assets within the ETF. VDGR’s net transaction cost is 0.00% per annum.
- Implication: This means that investors do not incur additional costs from the fund’s trading activities, which can eat into returns in other funds.
Brokerage Fee
- Description: The brokerage fee applies when buying or selling VDGR units through a Vanguard Personal Investor Account. There is no fee when purchasing and a $9 fee when selling.
- Implication: The zero purchase fee makes it cost-effective to enter the fund, while the $9 selling fee is modest and helps keep overall costs low.
Conclusion
In conclusion, VDGR offers a balanced and diversified investment solution that is well-suited for long-term investors. Its strategic mix of growth and income assets, combined with low costs and professional management, makes it a standout choice in the ETF market. By simplifying the investment process and providing a stable yet growth-oriented portfolio, VDGR helps investors achieve their financial objectives with confidence.
Whether you are a seasoned investor looking to enhance your portfolio or a newcomer seeking a reliable entry point into the market, VDGR provides a compelling option that aligns with a wide range of investment strategies and goals. By choosing VDGR, you are investing in a well-rounded, professionally managed, and cost-effective fund that supports your long-term financial success.
Frequently Asked Questions (FAQs)
What is the Vanguard Diversified Growth Index ETF (VDGR)?
VDGR is an exchange-traded fund (ETF) listed on the Australian Securities Exchange (ASX) under the code VDGR. It aims to provide long-term capital growth by investing in a diversified portfolio of growth and income assets.
What is the investment objective of VDGR?
The primary objective of VDGR is to provide investors with long-term capital growth by tracking the weighted average return of various indices of the underlying funds in which it invests.
What is the asset allocation of VDGR?
VDGR allocates approximately 70% of its portfolio to growth assets, such as shares, and 30% to income-producing assets, such as bonds and fixed interest investments.
What are the growth assets in VDGR?
The growth assets in VDGR include domestic shares, international shares, small companies, and emerging markets. These are invested through various underlying Vanguard funds.
What are the income assets in VDGR?
The income assets in VDGR include global bonds and domestic fixed interest investments. These assets are also managed through underlying Vanguard funds.
How often does VDGR distribute income?
VDGR distributes income to its investors on a quarterly basis. These distributions are derived from the income generated by the underlying assets, including dividends from shares and interest from bonds.
Can investors reinvest their distributions?
Yes, investors have the option to reinvest their distributions to purchase additional units of VDGR, allowing them to compound their investment over time.
How has VDGR performed historically?
VDGR has shown solid performance since its inception in November 2017. For example, its annualized return since inception is 6.62%, closely aligning with its benchmark.
What are the fees and costs associated with VDGR?
The fees and costs include:
Management Fee: 0.27% per annum
Indirect Costs: 0.00% per annum
Net Transaction Cost: 0.00% per annum
Brokerage Fee (Vanguard Personal Investor Account): $0 when purchasing, $9 when selling
What is the risk level of VDGR?
VDGR has a beta of 1.00 and a standard deviation of 9.79%, indicating a moderate level of risk and volatility. It is suitable for investors with a moderate to high risk tolerance.
Who is VDGR suitable for?
VDGR is ideal for long-term investors seeking capital growth with moderate risk. It is suitable for those who prefer a buy-and-hold strategy and are comfortable with market volatility.
How does VDGR compare with VDHG?
VDGR allocates 70% to growth assets and 30% to income assets, making it suitable for balanced growth. In contrast, VDHG allocates 90% to growth assets and 10% to income assets, targeting higher growth potential with higher risk.
How can I invest in VDGR?
Investors can buy VDGR through the Vanguard Personal Investor platform or through a financial adviser or stockbroker. You can search for VDGR on the ASX and place an order to buy or sell units.
What are the benefits of investing in VDGR?
Benefits include:
Diversification: Reduces risk by investing in a wide range of asset classes and regions.
Professional Management: Managed by Vanguard’s experienced investment team.
Cost Efficiency: Low management fee and no indirect or net transaction costs.
Long-term Growth: Strategic allocation aims to provide substantial capital appreciation over time.
How is VDGR managed and rebalanced?
Vanguard’s professional investment team continuously monitors and rebalances VDGR to ensure it remains aligned with its strategic asset allocation, maintaining the intended risk-return profile.
Expand Your Financial Knowledge: Visit our Personal Finance section for essential tips, delve into Property Investing for the latest market insights, or explore our comprehensive Resources for educational articles and tools. If you’re interested in the stock market, our Shares & ETFs section offers a range of options to suit your investment goals. Dive into these areas to enhance your financial understanding and decision-making.
Disclaimer
Estimations for Illustrative Purposes: The GST calculations generated by this Australian GST Calculator are approximations intended for educational and illustrative purposes only. While we strive for accuracy, actual GST liabilities may differ due to specific circumstances or changes in tax laws.
Excludes Other Considerations: This Australian GST Calculator focuses solely on Goods and Services Tax (GST) estimations. It does not incorporate other potential fiscal obligations, such as additional taxes, levies, or deductions that may impact the total amount payable when managing your finances or business operations.
Not Professional Financial Advice: The use of this GST calculator does not constitute financial advice. It is not intended to replace professional consultation and should not be the only factor in making financial decisions. For personalized financial guidance, we recommend seeking advice from a qualified tax consultant or financial advisor.
Use at Your Discretion: By using this Australian GST Calculator, you understand and agree that the outcomes are estimates and that your specific tax situation may vary. Any actions taken based on the calculator’s results are done at your own discretion and risk.
Not a Licensed Financial Advisor
The information and insights provided in this document are intended solely for educational and informational purposes. It’s imperative to understand that I am not a licensed financial advisor, tax expert, or investment strategist. The contents herein are crafted to offer a general overview and should not be construed as personalized financial advice.
Affiliate Disclosure: Some of the links on this blog may be affiliate links. This means if you click on the link and purchase a product or service, I may receive a commission at no additional cost to you. I only recommend products or services that I believe in, and that may be helpful to my readers.
Before making any financial decisions or embarking on investment ventures, it’s crucial to consult with a professional financial advisor or a certified tax consultant who is well-equipped to understand your unique financial landscape. Engaging with a licensed professional ensures that the advice you receive is tailored to your specific financial goals, risk tolerance, and tax obligations, adhering to the compliance and guidelines established by regulatory authorities, including the Australian Taxation Office (ATO) and other relevant bodies.
Financial markets are complex and dynamic and involve various degrees of risk. Therefore, thorough due diligence and professional guidance are essential to navigate these waters effectively. This content does not represent the opinions or endorsements of any financial institutions or regulatory agencies. Remember, the responsibility for financial decisions lies with the individual, and seeking qualified advice is the best step towards informed decision-making and achieving financial objectives.