
The Vanguard FTSE Emerging Markets ETF (VWO) is an exchange-traded fund that offers investors exposure to equities in emerging markets. These markets include developing economies such as China, India, Brazil, and South Africa, which have higher growth potential compared to developed markets. Managed by Vanguard, one of the world’s largest and most respected investment management companies, VWO provides a cost-effective way for investors to access a diversified portfolio of emerging market stocks.
What is an Exchange-Traded Fund (ETF)?
An ETF is a type of investment fund that is traded on stock exchanges, similar to individual stocks. ETFs typically aim to track the performance of a specific index, allowing investors to gain exposure to a wide range of assets through a single investment vehicle. In the case of VWO, the fund tracks the FTSE Emerging Markets All Cap China A Inclusion Index, which includes a broad selection of stocks from emerging market countries.
Managed by Vanguard
Vanguard is renowned for its low-cost investment options and commitment to investor education. The company’s expertise in managing index funds is evident in VWO’s performance and cost efficiency. Vanguard’s management of VWO involves meticulous tracking of the FTSE Emerging Markets All Cap China A Inclusion Index, ensuring that the fund closely follows the index’s performance.
Tracking the FTSE Emerging Markets All Cap China A Inclusion Index
The FTSE Emerging Markets All Cap China A Inclusion Index is a market-capitalization-weighted index that represents the performance of large, mid, and small-cap stocks in emerging markets. This index includes China A-shares, which are stocks of Chinese companies listed on the Shanghai and Shenzhen stock exchanges. The inclusion of these shares provides broader exposure to the Chinese market, which is one of the largest and fastest-growing economies in the world.
Fund Basics
VWO provides investors with a low-cost way to gain exposure to a wide array of emerging market stocks. Below are the basic details of the fund:
| Metric | Value |
|---|---|
| Ticker Symbol | VWO |
| CUSIP | 922042858 |
| Inception Date | March 4, 2005 |
| Management Style | Index |
| Asset Class | International/Global Stock |
| Category | Diversified Emerging Markets |
The ticker symbol for VWO is VWO, and it is categorized under diversified emerging markets. The CUSIP, which is a unique identifier for financial instruments, for VWO ETF is 922042858. The fund was established on March 4, 2005, providing investors with nearly two decades of performance history.
Management Style
VWO uses an index management style, meaning the fund aims to replicate the performance of a specific index rather than attempting to outperform it. This passive management approach involves holding a diverse portfolio of stocks that mirror the composition and performance of the FTSE Emerging Markets All Cap China A Inclusion Index. This strategy typically results in lower management fees and operating expenses compared to actively managed funds.
Asset Class and Category
The asset class for VWO is international/global stock, indicating that the fund invests in equities of companies located outside the United States, specifically in emerging markets. VWO falls under the category of diversified emerging markets, which includes a mix of large, mid, and small-cap stocks from various sectors and regions within emerging markets.
Fund Objective and Strategy
The primary goal of VWO is to closely track the performance of the FTSE Emerging Markets All Cap China A Inclusion Index. This index is composed of stocks from large, mid, and small-cap companies in emerging markets such as China, Brazil, Taiwan, and South Africa.
Investment Strategy
To achieve its objective, VWO employs the following strategies:
Sampling Method: VWO uses a sampling method to replicate the index. This means the fund does not hold every security in the index but instead holds a broad selection of securities that approximate the index’s key characteristics. This method helps in managing costs and maintaining liquidity while still closely tracking the index’s performance.
Diversification: The fund ensures diversified exposure by investing in a wide range of stocks from different sectors and regions within the emerging markets. Diversification helps in spreading out risk and reducing the impact of poor performance from any single investment.
Key Characteristics:
- Broad Exposure: VWO offers exposure to a wide array of companies in emerging markets, providing investors with the potential for growth in developing economies.
- Cost Efficiency: By using an index management style and sampling method, VWO keeps its expense ratio low, making it a cost-effective investment option.
- Long-Term Growth Potential: Emerging markets are known for their high growth potential compared to developed markets, making VWO a suitable option for investors with a long-term investment horizon.
This strategy allows VWO to provide investors with the benefits of diversification and exposure to high-growth markets, while maintaining the cost advantages of passive management. By closely tracking the FTSE Emerging Markets All Cap China A Inclusion Index, VWO aims to deliver returns that reflect the performance of these dynamic and rapidly growing economies.
Key Facts and Figures
Understanding the key facts and figures of VWO helps investors gauge its performance and cost-effectiveness. Here are the crucial details:
| Metric | Value |
|---|---|
| Expense Ratio | 0.08% |
| Net Asset Value (NAV) | $44.60 (as of 07/18/2024) |
| Market Price | $44.36 (as of 07/18/2024) |
| YTD Returns (NAV) | 9.04% |
| YTD Returns (Market Price) | 8.44% |
| Total Net Assets | $107.8 billion |
| Number of Stocks | 5849 |
Expense Ratio
The expense ratio of VWO is 0.08%, which is significantly lower than the average for similar funds. This low expense ratio means that a smaller portion of the fund’s assets are used to cover operating expenses, allowing more of the investment to remain invested in the market. For investors, this translates to higher net returns over time, making VWO a cost-effective choice. Here’s a comparison with average expense ratios of similar funds:
| Fund Category | Average Expense Ratio |
|---|---|
| VWO | 0.08% |
| Average Emerging Markets ETF | 1.13% |
Net Asset Value (NAV) and Market Price
The NAV of VWO as of July 18, 2024, is $44.60, while the market price is $44.36. The NAV represents the per-share value of the fund’s assets minus liabilities, calculated at the end of each trading day. The market price, on the other hand, is the price at which VWO shares are traded on the stock exchange during market hours.
The close alignment between the NAV and the market price indicates efficient management and low tracking error. Tracking error measures how closely the fund’s performance follows its benchmark index. A low tracking error, as seen with VWO, suggests that the fund is effectively replicating the performance of the FTSE Emerging Markets All Cap China A Inclusion Index.
Year-to-Date (YTD) Returns
Year-to-date returns provide a snapshot of the fund’s performance from the beginning of the year to the current date. As of July 18, 2024, VWO has delivered:
- NAV YTD Returns: 9.04%
- Market Price YTD Returns: 8.44%
These returns reflect the fund’s growth and its ability to generate positive performance in the current market environment. The slight difference between NAV and market price returns can be attributed to the daily fluctuations in the market price due to trading activity.
Total Net Assets
VWO manages total net assets of $107.8 billion. This large asset base highlights the fund’s popularity and the trust investors place in it. A higher level of assets under management can lead to greater liquidity, meaning that investors can buy and sell shares without significantly affecting the market price.
Number of Stocks
VWO holds 5849 stocks, offering extensive diversification. Holding a large number of stocks across various sectors and regions within emerging markets helps spread out risk and reduces the impact of poor performance from any single investment. This broad diversification is a key feature that makes VWO attractive to investors looking for exposure to emerging markets.
Holdings and Allocation
VWO’s holdings and allocation strategy provide investors with diversified exposure to a wide range of sectors and regions within emerging markets. Here, we detail the fund’s top holdings, sector allocation, and geographical distribution.
Top 10 Holdings
The top 10 holdings represent 21.54% of the total assets and include some of the largest and most influential companies in emerging markets. These companies are leaders in their respective industries, offering strong growth potential and significant market presence.
| Company | Percentage of Fund |
|---|---|
| Taiwan Semiconductor Manufacturing Co. Ltd. | 8.58% |
| Tencent Holdings Ltd. | 3.59% |
| Alibaba Group Holding Ltd. | 1.85% |
| Reliance Industries Ltd. | 1.50% |
| HDFC Bank Ltd. | 1.37% |
| PDD Holdings Inc. ADR | 1.13% |
| Hon Hai Precision Industry Co. Ltd. | 0.95% |
| Meituan Dianping Class B | 0.92% |
| China Construction Bank Corp. Class H | 0.83% |
| Infosys Ltd. | 0.79% |
Key Points:
- Taiwan Semiconductor Manufacturing Co. Ltd. (TSMC): As the largest holding, TSMC accounts for 8.58% of the fund. TSMC is a global leader in semiconductor manufacturing, providing critical technology for numerous industries.
- Tencent Holdings Ltd.: This Chinese conglomerate, with a 3.59% allocation, is known for its dominance in social media, digital payments, and gaming.
- Alibaba Group Holding Ltd.: Representing 1.85% of the fund, Alibaba is a leading e-commerce and technology company in China.
- Reliance Industries Ltd.: With a 1.50% allocation, this Indian multinational operates in energy, petrochemicals, textiles, natural resources, retail, and telecommunications.
- HDFC Bank Ltd.: India’s largest private sector bank by assets, HDFC Bank constitutes 1.37% of the fund.
- PDD Holdings Inc. ADR, Hon Hai Precision Industry Co. Ltd., Meituan Dianping Class B, China Construction Bank Corp. Class H, and Infosys Ltd.: These companies collectively contribute to the fund’s diversity, spanning industries from technology and manufacturing to banking and e-commerce.
Sector Allocation
VWO is diversified across various sectors, ensuring that the fund is not overly dependent on any single industry. This sector diversification helps mitigate risks associated with sector-specific downturns.
| Sector | Percentage of Fund |
|---|---|
| Financial Services | 21.20% |
| Technology | 20.41% |
| Consumer Cyclical | 12.05% |
| Communication Services | 8.69% |
| Industrials | 8.55% |
| Basic Materials | 7.83% |
| Energy | 5.75% |
| Consumer Defensive | 5.34% |
| Healthcare | 3.97% |
| Utilities | 3.67% |
| Real Estate | 2.54% |
Key Points:
- Financial Services and Technology: These sectors have the highest allocations, reflecting their significant roles in emerging markets. Financial services account for 21.20% and technology for 20.41% of the fund.
- Consumer Cyclical and Communication Services: These sectors represent 12.05% and 8.69% of the fund, respectively, highlighting the growing consumer markets and communication infrastructure in emerging economies.
- Industrials and Basic Materials: These sectors, comprising 8.55% and 7.83% of the fund, respectively, are crucial for the industrial and economic development of emerging markets.
- Energy, Consumer Defensive, Healthcare, Utilities, and Real Estate: These sectors ensure that the fund has a balanced exposure across various critical areas of the economy.
Geographical Allocation
VWO’s geographical allocation highlights its exposure to major emerging markets, providing investors with a diversified portfolio that spans multiple regions. This geographic diversification helps reduce the risk associated with investing in a single country or region.
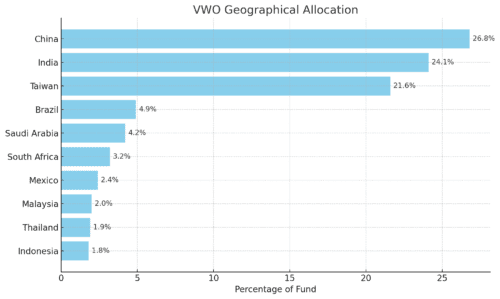
Key Points:
- China, India, and Taiwan: These countries represent the largest portions of the fund, with China at 26.80%, India at 24.10%, and Taiwan at 21.60%. These economies are among the fastest-growing and most influential in the emerging markets.
- Brazil and Saudi Arabia: With allocations of 4.90% and 4.20%, respectively, these countries add to the fund’s diversity and exposure to different economic environments.
- South Africa, Mexico, Malaysia, Thailand, and Indonesia: These countries, while smaller in their individual contributions, collectively enhance the fund’s regional diversification, capturing a wide range of economic activities and growth opportunities across emerging markets.
Performance Overview
The Vanguard FTSE Emerging Markets ETF (VWO) has demonstrated solid performance across various timeframes. This section provides a detailed analysis of the fund’s performance metrics as of June 30, 2024.
Key Performance Metrics
Below are the performance metrics for VWO over different time periods, showing both market price returns and NAV returns:
| Time Period | Market Price Return | NAV Return |
|---|---|---|
| 1 Month | 1.90% | 2.23% |
| 3 Months | 5.10% | 5.30% |
| YTD | 6.93% | 7.33% |
| 1 Year | 11.26% | 11.95% |
| 3 Years | -3.81% | -3.65% |
| 5 Years | 3.71% | 3.81% |
| 10 Years | 3.02% | 3.04% |
| Since Inception | 5.60% | 5.62% |
1 Month: Over the past month, VWO has delivered a market price return of 1.90% and an NAV return of 2.23%. This short-term performance indicates the fund’s ability to capture positive market movements within emerging markets.
3 Months: In the last three months, VWO’s market price return was 5.10%, while its NAV return was 5.30%. This consistent performance over a quarter reflects the fund’s stability and effective management.
Year-to-Date (YTD): For the year-to-date period, VWO has provided a market price return of 6.93% and an NAV return of 7.33%. These figures highlight the fund’s solid performance in the current year, driven by strong growth in emerging markets.
1 Year: Over the past year, VWO’s market price return was 11.26%, and its NAV return was 11.95%. This annual performance underscores the fund’s ability to generate double-digit returns, showcasing its potential for significant growth.
3 Years: Despite some volatility, VWO has managed a market price return of -3.81% and an NAV return of -3.65% over the last three years. This performance reflects the challenges and fluctuations inherent in emerging markets but also the fund’s resilience in maintaining relatively close alignment with its NAV.
5 Years: Over the five-year period, VWO achieved a market price return of 3.71% and an NAV return of 3.81%. These returns indicate moderate growth and the fund’s capacity to deliver consistent performance over a medium-term horizon.
10 Years: VWO’s market price return over the past decade is 3.02%, with an NAV return of 3.04%. This long-term performance demonstrates the fund’s ability to provide steady returns, reflecting the growth potential of emerging markets.
Since Inception: Since its inception, VWO has delivered a market price return of 5.60% and an NAV return of 5.62%. These returns reflect the fund’s long-term growth trajectory and its effectiveness in tracking the FTSE Emerging Markets All Cap China A Inclusion Index.
Performance Comparison with Benchmarks
Comparing VWO’s performance to its benchmark helps investors understand how well the fund is tracking its index. Below are the performance comparisons over various time periods:
| Metric | VWO (Market Price) | VWO (NAV) | Benchmark |
|---|---|---|---|
| 3-Month Total | 5.10% | 5.30% | 5.64% |
| 1-Year | 11.26% | 11.95% | 13.38% |
| 3-Year | -3.81% | -3.65% | -3.23% |
| 5-Year | 3.71% | 3.81% | 4.14% |
| 10-Year | 3.02% | 3.04% | 3.18% |
| Since Inception | 5.60% | 5.62% | 5.79% |
3-Month Total: Over the past three months, VWO’s market price return of 5.10% and NAV return of 5.30% are slightly below the benchmark return of 5.64%, indicating close tracking but with a minor tracking error.
1-Year: In the past year, VWO’s market price return of 11.26% and NAV return of 11.95% are slightly below the benchmark return of 13.38%. This performance gap highlights the challenges of exact replication in volatile markets but still reflects strong alignment with the index.
3-Year: Over the three-year period, VWO’s returns are slightly negative, with market price and NAV returns of -3.81% and -3.65%, respectively, compared to the benchmark’s -3.23%. This minor underperformance is indicative of the inherent risks and volatility in emerging markets.
5-Year: For the five-year period, VWO’s market price return of 3.71% and NAV return of 3.81% are marginally lower than the benchmark’s 4.14%. This difference shows the fund’s generally effective tracking with some deviation over longer periods.
10-Year: VWO’s market price return of 3.02% and NAV return of 3.04% over the past decade are slightly below the benchmark return of 3.18%, demonstrating effective long-term tracking with minor discrepancies.
Since Inception: Since its inception, VWO’s market price return of 5.60% and NAV return of 5.62% are closely aligned with the benchmark return of 5.79%, reflecting the fund’s strong long-term performance and effective index tracking.
These performance figures reflect VWO’s ability to deliver strong returns, particularly over longer periods, despite short-term fluctuations. The fund’s NAV and market price returns are closely aligned, demonstrating effective tracking of the FTSE Emerging Markets All Cap China A Inclusion Index. This alignment indicates efficient management and low tracking error, making VWO a reliable option for investors seeking exposure to emerging markets.
Fund Characteristics
VWO exhibits several key characteristics that make it a compelling investment option for investors seeking exposure to emerging markets. These characteristics provide insight into the fund’s composition, stability, and potential for growth.
| Metric | Value |
|---|---|
| Median Market Cap | $22.9 billion |
| P/E Ratio | 15.1x |
| P/B Ratio | 2.1x |
| Turnover Rate | 4.5% |
| Earnings Growth Rate | 16.1% |
| Return on Equity | 14.7% |
Median Market Cap
The median market cap of VWO is $22.9 billion. This metric indicates that the fund primarily invests in large, established companies within emerging markets. A higher median market cap suggests that the fund includes companies that are more stable and less prone to volatility compared to smaller companies. These large-cap companies typically have a stronger market presence and more resources to sustain growth and navigate economic challenges.
Price-to-Earnings (P/E) Ratio
The P/E ratio of VWO is 15.1x. The P/E ratio measures a company’s current share price relative to its per-share earnings. A P/E ratio of 15.1x implies that investors are willing to pay $15.10 for every $1 of earnings generated by the companies within the fund. This ratio is an essential indicator of market expectations and valuation. For VWO, a P/E ratio of 15.1x suggests a reasonable valuation, reflecting both growth potential and inherent risks associated with emerging markets.
Price-to-Book (P/B) Ratio
The P/B ratio for VWO is 2.1x. The P/B ratio compares a company’s market value to its book value. A P/B ratio of 2.1x means that investors are paying $2.10 for every $1 of net assets (assets minus liabilities) owned by the companies in the fund. This ratio helps assess whether a stock is undervalued or overvalued. A P/B ratio of 2.1x indicates that VWO’s holdings are valued at a premium, which is common for companies with strong growth prospects and profitability in emerging markets.
Turnover Rate
VWO has a turnover rate of 4.5%. The turnover rate measures the frequency with which assets within the fund are bought and sold over a year. A lower turnover rate, like VWO’s 4.5%, suggests a relatively stable portfolio with minimal trading. This stability can result in lower transaction costs and better tax efficiency for investors, as frequent trading can lead to higher capital gains taxes and increased fund expenses.
Earnings Growth Rate
The earnings growth rate for VWO is 16.1%. This metric represents the annualized rate at which the earnings of the companies within the fund are expected to grow. An earnings growth rate of 16.1% indicates strong potential for revenue and profit expansion, driven by the rapid development and industrialization in emerging markets. This growth rate is a positive sign for investors, as it suggests that the companies in VWO are likely to generate increasing earnings over time.
Return on Equity (ROE)
VWO’s return on equity is 14.7%. ROE measures a company’s profitability by revealing how much profit a company generates with the money shareholders have invested. An ROE of 14.7% indicates that the companies within VWO are effectively using their equity base to generate profits. High ROE values are typically associated with companies that have strong competitive advantages, efficient management, and profitable business operations.
The key characteristics of VWO highlight its strengths as an investment option in emerging markets. With a median market cap of $22.9 billion, the fund provides exposure to large, stable companies. The P/E ratio of 15.1x and P/B ratio of 2.1x reflect reasonable valuations and growth potential. The low turnover rate of 4.5% indicates a stable portfolio, while the earnings growth rate of 16.1% and return on equity of 14.7% underscore the fund’s potential for strong financial performance. These characteristics make VWO an attractive option for investors looking to benefit from the growth opportunities in emerging markets while maintaining a diversified and relatively stable investment.
Expense and Yield
Understanding the expenses and yield of an investment fund is crucial for investors to assess its cost-effectiveness and income potential.
| Metric | Value |
|---|---|
| Expense Ratio | 0.08% |
| Dividend Yield | Varies quarterly |
Expense Ratio
VWO’s expense ratio is 0.08%, which is significantly lower than the average expense ratios of similar funds in the emerging markets category. This low expense ratio is one of VWO’s key advantages, making it a cost-effective option for investors. Here’s why a low expense ratio matters:
- Cost Savings: A lower expense ratio means that a smaller portion of the fund’s assets is used to cover operating expenses, allowing more of the investment to remain invested in the market. Over time, this can lead to higher net returns for investors.
- Efficiency: Vanguard’s ability to keep costs low reflects its efficient management and operational practices. Lower expenses do not compromise the quality of fund management but instead demonstrate Vanguard’s commitment to providing value to investors.
Comparison with Industry Averages:
| Fund Category | Average Expense Ratio |
|---|---|
| VWO | 0.08% |
| Average Emerging Markets ETF | 1.13% |
Dividend Yield
VWO distributes dividends on a quarterly basis, providing a regular income stream for investors. The dividend yield varies each quarter based on the earnings and profits of the underlying companies within the fund. Here’s why the quarterly dividend distribution is beneficial:
- Regular Income: Quarterly dividends provide investors with periodic income, which can be particularly attractive for those seeking steady cash flow from their investments.
- Reinvestment Opportunities: Investors can choose to reinvest their dividends to purchase more shares of VWO, potentially enhancing their returns through the power of compounding.
- Income Stability: Regular dividend payments add a level of income stability, which can be an essential component of an investor’s overall portfolio strategy.
Risks
Investing in VWO involves several risks due to its focus on emerging markets. Understanding these risks is essential for making informed investment decisions.
Types of Risks
| Risk Type | Description |
|---|---|
| Stock Market Risk | Possibility of stock prices declining. |
| Country/Regional Risk | Potential impact of political, financial, or natural events in foreign countries. |
| Emerging Markets Risk | Higher volatility and less liquidity compared to developed markets. |
| Currency Risk | The value of foreign investments may decrease due to unfavorable currency exchange rates. |
| Index Sampling Risk | The fund may not perfectly match the performance of its target index. |
| China A-Shares Risk | Limited access to China A-shares could affect tracking the index. |
Stock Market Risk
Stock market risk is the possibility of stock prices declining, which can negatively impact the value of the fund’s holdings. This risk is inherent in all equity investments and is influenced by factors such as economic conditions, investor sentiment, and market dynamics.
Country/Regional Risk
Country or regional risk refers to the potential impact of political, financial, or natural events in foreign countries on the value of investments. This risk is particularly pronounced in emerging markets, where political instability, economic crises, or natural disasters can lead to significant market fluctuations.
Emerging Markets Risk
Emerging markets risk is characterized by higher volatility and less liquidity compared to developed markets. The financial systems and regulatory frameworks in emerging markets are often less mature, which can result in greater price swings and difficulties in buying or selling securities at desired prices.
Currency Risk
Currency risk arises from changes in exchange rates that can negatively affect the value of foreign investments when measured in U.S. dollars. For VWO, which invests in companies that operate in various emerging market currencies, unfavourable currency fluctuations can impact returns.
Index Sampling Risk
Index sampling risk occurs when the securities selected for the fund do not perfectly replicate the performance of the target index. Although VWO aims to closely track the FTSE Emerging Markets All Cap China A Inclusion Index, minor deviations may be due to the sampling method used.
China A-Shares Risk
China A-shares risk is associated with the limited access to China A-shares for foreign investors. These shares are traded on Chinese stock exchanges and are subject to quotas and regulatory restrictions. Limited access to these shares can affect the fund’s ability to track its target index accurately.
VWO offers a cost-effective investment option with a low expense ratio of 0.08% and quarterly dividend distributions. However, investing in VWO involves several risks, particularly those associated with emerging markets. These include stock market risk, country/regional risk, emerging markets risk, currency risk, index sampling risk, and China A-shares risk. Understanding these risks and the potential for significant price swings is crucial for investors considering exposure to emerging markets through VWO. By weighing the cost advantages and income potential against the inherent risks, investors can make informed decisions about including VWO in their investment portfolios.
Conclusion
The Vanguard FTSE Emerging Markets ETF (VWO) offers a compelling opportunity for investors seeking to diversify their portfolios by gaining exposure to emerging markets. This ETF is particularly attractive for several reasons:
Low Expense Ratio
One of VWO’s standout features is its low expense ratio of 0.08%. This cost efficiency is a significant advantage, especially when compared to the average expense ratios of similar funds, which can be over 1%. A lower expense ratio means that a smaller portion of the fund’s assets is used to cover operating expenses, allowing more of the investment to remain in the market. Over time, these cost savings can lead to higher net returns for investors.
Broad Diversification
VWO offers extensive diversification across various sectors and regions within emerging markets. This broad exposure helps mitigate risks associated with investing in any single sector or country. The fund’s holdings include a mix of large, mid, and small-cap stocks, providing a balanced approach to capturing the growth potential of emerging economies.
Strong Performance
VWO has shown solid performance across various timeframes. The fund has delivered consistent returns, particularly over longer periods, demonstrating its ability to capitalize on the growth potential of emerging markets.
Frequently Asked Questions (FAQs)
Is VWO ETF a good investment
VWO ETF can be a good investment for those looking to diversify their portfolio by gaining exposure to emerging markets. It offers a low expense ratio, broad diversification, and the potential for higher returns associated with emerging market economies. However, it also comes with higher volatility and risks compared to developed market investments.
Does VWO pay monthly dividends?
No, VWO does not pay monthly dividends. VWO distributes dividends on a quarterly basis, providing regular income to its investors.
Is Vanguard emerging markets a good investment?
Vanguard emerging markets funds, like VWO, can be a good investment for those seeking exposure to high-growth economies. These funds offer diversification and potential for high returns but also carry higher risks due to the volatility and economic instability often associated with emerging markets.
Is VWO active or passive?
VWO is a passive ETF. It aims to replicate the performance of the FTSE Emerging Markets All Cap China A Inclusion Index by using an indexing investment approach, which involves holding a diversified collection of securities that approximate the ind
Which emerging market ETF is best?
The best emerging market ETF depends on individual investment goals and risk tolerance. VWO is one of the largest and most popular emerging market ETFs, known for its low expense ratio and broad diversification. Other notable options include iShares MSCI Emerging Markets ETF (EEM) and Schwab Emerging Markets Equity ETF (SCHE).
Who uses VWO?
VWO is used by a wide range of investors, including individual retail investors, financial advisors, and institutional investors. It is suitable for those looking to add emerging market exposure to their investment portfolios.
What is Vanguard’s best-performing ETF?
Vanguard’s best-performing ETF can vary depending on the time period and market conditions. Historically, some of the top-performing Vanguard ETFs include Vanguard Information Technology ETF (VGT) and Vanguard S&P 500 ETF (VOO). It’s important to evaluate performance based on specific investment goals and time horizons.
Are emerging market ETFs risky?
Yes, emerging market ETFs are generally considered riskier than those focused on developed markets. They are subject to higher volatility, political and economic instability, and currency risk. However, they also offer the potential for higher returns due to the rapid growth and development in emerging economies.
What is the yield of VWO?
The dividend yield of VWO varies each quarter based on the earnings and profits of the underlying companies within the fund. Investors can check the latest yield information on Vanguard’s website or financial market platforms.
Which is better VWO or VXUS?
The choice between VWO and VXUS depends on investment goals. VWO focuses exclusively on emerging markets, while VXUS (Vanguard Total International Stock ETF) includes both developed and emerging markets. VXUS offers broader international exposure, while VWO provides targeted exposure to high-growth emerging markets. Investors should consider their risk tolerance and investment objectives when choosing between the two.
How does VWO compare to other emerging market ETFs?
VWO is known for its low expense ratio and broad diversification. Compared to other emerging market ETFs like EEM (iShares MSCI Emerging Markets ETF), VWO typically offers lower costs and similar or better performance due to its efficient management.
What sectors does VWO invest in?
VWO invests in a variety of sectors including financial services, technology, consumer cyclical, communication services, and industrials. This diversification helps spread risk across different parts of the emerging market economies.
How does VWO manage currency risk
VWO does not hedge currency risk. This means that fluctuations in exchange rates between the U.S. dollar and the currencies of the countries in which the fund invests can affect returns. Investors should be aware of this risk when investing in VW
Can I reinvest dividends from VWO?
Yes, investors can choose to reinvest dividends from VWO to purchase additional shares of the ETF, potentially enhancing their returns through compounding over ti
What is the historical performance of VWO?
VWO has shown solid performance over various timeframes, particularly in the long term. The historical performance data indicates that VWO can deliver strong returns, though it is also subject to the volatility and risks associated with emerging markets
Expand Your Financial Knowledge: Visit our Personal Finance section for essential tips, delve into Property Investing for the latest market insights, or explore our comprehensive Resources for educational articles and tools. If you’re interested in the stock market, our Shares & ETFs section offers a range of options to suit your investment goals. Dive into these areas to enhance your financial understanding and decision-making.
Disclaimer
Estimations for Illustrative Purposes: The GST calculations generated by this Australian GST Calculator are approximations intended for educational and illustrative purposes only. While we strive for accuracy, actual GST liabilities may differ due to specific circumstances or changes in tax laws.
Excludes Other Considerations: This Australian GST Calculator focuses solely on Goods and Services Tax (GST) estimations. It does not incorporate other potential fiscal obligations, such as additional taxes, levies, or deductions that may impact the total amount payable when managing your finances or business operations.
Not Professional Financial Advice: The use of this GST calculator does not constitute financial advice. It is not intended to replace professional consultation and should not be the only factor in making financial decisions. For personalized financial guidance, we recommend seeking advice from a qualified tax consultant or financial advisor.
Use at Your Discretion: By using this Australian GST Calculator, you understand and agree that the outcomes are estimates and that your specific tax situation may vary. Any actions taken based on the calculator’s results are done at your own discretion and risk.
Not a Licensed Financial Advisor
The information and insights provided in this document are intended solely for educational and informational purposes. It’s imperative to understand that I am not a licensed financial advisor, tax expert, or investment strategist. The contents herein are crafted to offer a general overview and should not be construed as personalized financial advice.
Affiliate Disclosure: Some of the links on this blog may be affiliate links. This means if you click on the link and purchase a product or service, I may receive a commission at no additional cost to you. I only recommend products or services that I believe in, and that may be helpful to my readers.
Before making any financial decisions or embarking on investment ventures, it’s crucial to consult with a professional financial advisor or a certified tax consultant who is well-equipped to understand your unique financial landscape. Engaging with a licensed professional ensures that the advice you receive is tailored to your specific financial goals, risk tolerance, and tax obligations, adhering to the compliance and guidelines established by regulatory authorities, including the Australian Taxation Office (ATO) and other relevant bodies.
Financial markets are complex and dynamic and involve various degrees of risk. Therefore, thorough due diligence and professional guidance are essential to navigate these waters effectively. This content does not represent the opinions or endorsements of any financial institutions or regulatory agencies. Remember, the responsibility for financial decisions lies with the individual, and seeking qualified advice is the best step towards informed decision-making and achieving financial objectives.