
If you’re an investor looking to diversify your portfolio internationally, the Vanguard MSCI Index International Shares ETF (VGS) is likely on your radar. This exchange-traded fund (ETF) provides exposure to companies in major developed markets around the world, excluding Australia.
With over $4 billion in assets under management, VGS is one of the largest and most liquid international equity ETFs on the Australian Securities Exchange (ASX). But is it the right international investment for your needs? Let’s dive into a comprehensive review.
What is the VGS ETF?
Launched in 2014, the VGS ETF aims to track the performance of the MSCI World ex-Australia Index, which represents around 1,500 stocks across 22 developed nations. By investing in VGS, you get exposure to major global companies like Apple, Microsoft, Amazon, and more.
Some key facts about VGS:
- Issuer: Vanguard
- Benchmark: MSCI World ex-Australia Index
- Holdings: Around 1,500 international stocks
- Weighted Averages: P/E 21.3x, P/B 3.2x
- Expense Ratio: 0.18%
- Dividend Yield: Around 1.8% (paid quarterly)
- Launched: May 2014
One of VGS’s major draws is its broad diversification across countries, industries, and individual securities. Let’s examine the fundamentals in more detail.
VGS Holdings, Sectors & Country Exposure
The VGS portfolio is market cap-weighted, meaning larger companies make up a bigger slice of the total holdings. Here’s a breakdown of the top 10 holdings as of the latest data:
Top 10 Holdings Chart
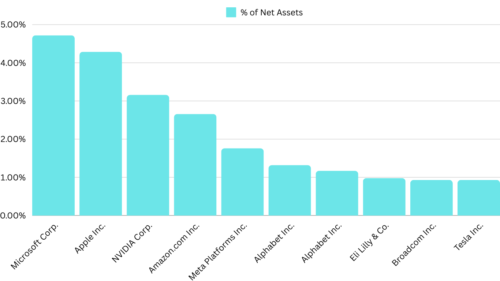
As you can see, it’s heavily tilted toward major U.S. tech giants and other large multinationals. The top 10 holdings account for around 14% of the total portfolio weight.
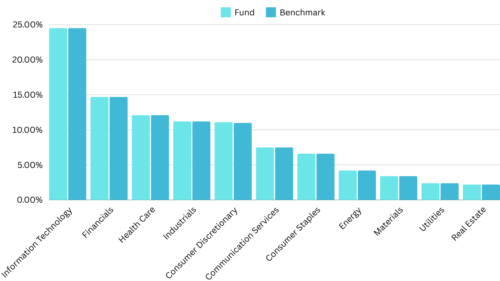
In terms of sector exposure, Information Technology (24.5%), Financials (14.7%), and Healthcare (12.2%) are the top represented sectors in VGS.
Sector Breakdown
From a country perspective, the U.S. dominates at around 72.3% of the total portfolio, followed by Japan (6.3%), UK (3.8%), and Canada (3.5%).
Country Exposure
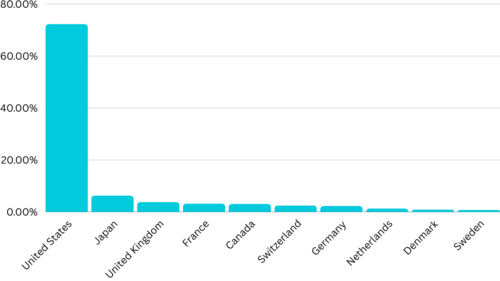
While heavily U.S.-focused, VGS does provide reasonable geographic diversification across Europe, Asia, and North America through its underlying index.
Historical Performance & Dividends
One of the most important factors for ETF investors is past performance. How has VGS actually delivered in terms of returns and income?
Looking at total returns data from the last 5 calendar years:
Total Returns
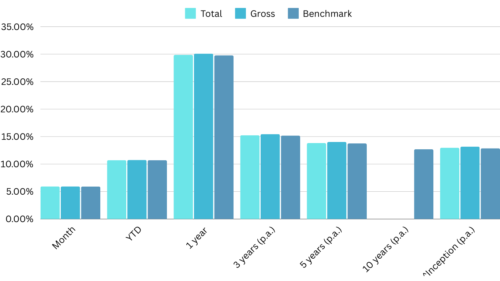
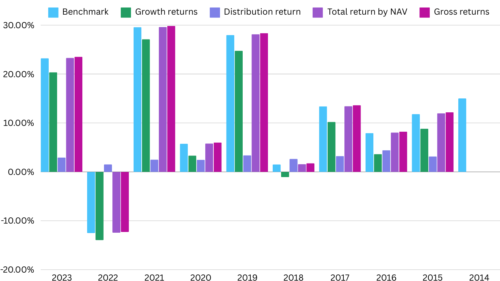
Annual performance of the VAS investment
Below table and chart details the annual performance of the VAS investment across various metrics from 2014 to 2023. It includes growth returns, distribution returns, total return by NAV (Net Asset Value), gross returns, and comparisons to a benchmark. Here’s the summary:
- Varied Annual Performance: The chart shows a mix of positive and negative performance years. Notably, 2022 experienced a downturn with a -13.98% growth return and a total return by NAV of -12.45%, indicating a challenging year for the investment. Conversely, 2021 was a standout year with a 27.11% growth return and a total return by NAV of 29.61%, showcasing significant growth.
- Consistent Distribution Returns: Despite fluctuations in growth returns, distribution returns remained relatively consistent, contributing positively to the total return by NAV each year. The distribution return peaked in 2016 at 4.42%.
- Total Return by NAV: The total return by NAV, which combines growth and distribution returns, fluctuated significantly over the years, reaching its highest in 2021 at 29.61% and its lowest (negatively) in 2022 at -12.45%.
- Gross Returns and Benchmark Comparisons: The investment’s gross returns closely mirrored its benchmark performance in most years, occasionally outperforming it, such as in 2021 (29.84% gross returns vs. 29.58% benchmark) and underperforming in years like 2022 (-12.29% gross returns vs. -12.52% benchmark).
- Notable Trends: The data points to significant recovery and growth periods, such as the sharp rebound in 2021 following a challenging 2020 marked by modest gains. However, 2022 highlighted vulnerability with negative returns across growth, total NAV, and gross returns, contrasting with the overall upward trend seen in previous years.
- Benchmark Data for 2014: The chart includes benchmark data for 2014 (15.01%) without corresponding VAS performance metrics, indicating a possible starting point for benchmark comparison but lacking VAS data for that year.
| Year | Growth returns | Distribution return | Total return by NAV | Gross returns | Benchmark |
|---|---|---|---|---|---|
| 2023 | 20.36% | 2.94% | 23.30% | 23.53% | 23.23% |
| 2022 | -13.98% | 1.53% | -12.45% | -12.29% | -12.52% |
| 2021 | 27.11% | 2.50% | 29.61% | 29.84% | 29.58% |
| 2020 | 3.33% | 2.47% | 5.80% | 5.99% | 5.73% |
| 2019 | 24.76% | 3.38% | 28.14% | 28.37% | 27.97% |
| 2018 | -1.08% | 2.66% | 1.58% | 1.76% | 1.52% |
| 2017 | 10.20% | 3.23% | 13.43% | 13.64% | 13.38% |
| 2016 | 3.62% | 4.42% | 8.03% | 8.23% | 7.92% |
| 2015 | 8.82% | 3.15% | 11.98% | 12.18% | 11.80% |
| 2014 | — | — | — | — | 15.01% |
VGS – Key Characteristic’s
Below are some of the key facts about an VGS Exchange-Traded Fund (ETF), providing a snapshot of its structure, cost, and size:
- Management Fee: The ETF charges a management fee of 0.18% per annum, which is a relatively low cost for investors, indicating an efficient expense structure for the fund.
- Inception Date: The ETF was established on 18 November 2014, showing it has been operational for nearly a decade, providing a track record for potential investors to assess.
- Income Distribution: Income is distributed to investors quarterly, offering a regular income stream that could appeal to those seeking consistent returns.
- Distribution Reinvestment Plan: The ETF offers a distribution reinvestment plan, allowing investors to automatically reinvest dividends into additional shares of the ETF, which can be beneficial for compounding returns over time.
- ETF Size: The size of the ETF is $7,356.2 million, indicating a substantial amount of assets under management and suggesting a level of investor confidence and scale.
- Total Fund Size: The overall size of the fund, presumably including assets beyond just this ETF, is $35,969.3 million, highlighting the breadth of the fund’s operations and its significant footprint in the investment landscape.
- Number of Holdings: With 1,421 holdings, the ETF provides a highly diversified investment option, spreading risk across a broad range of assets which can be an attractive feature for investors looking to mitigate individual asset volatility.
Overall, these facts paint a picture of a well-established, low-cost, and sizeable ETF offering regular income distributions and the option for reinvestment, suited for investors seeking a diversified and potentially growing investment.
The Final Verdict
All in all, the Vanguard MSCI Index International Shares ETF (VGS) shapes up as an extremely solid, cost-effective investment choice for those seeking developed international diversification.
With its ultra-low fees, substantial AUM (Assets under management) size, strong performance track record, and quarterly dividend payouts, VGS ticks a lot of boxes for buy-and-hold investors.
Potential drawbacks like the heavy U.S. tilt, lack of emerging markets coverage, and exclusion of smaller nations are trade-offs to consider. But for effortless global equity indexing, VGS is hard to beat.
Whether you make it a core portfolio holding or a equity satellite allocation, VGS deserves a spot on the radar for cost-conscious Australian ETF investors.
Frequently Asked Questions About VGS
What is the VGS ETF?
VGS is an exchange-traded fund that tracks the MSCI World ex-Australia Index, providing exposure to around 1,500 stocks in major developed markets globally, excluding Australia.
Is VGS ETF a good investment?
VGS can be an excellent investment for those seeking broad-based, low-cost exposure to international developed market equities. Its diversification, low fees, and historical performance make it appealing to many investors.
What are the risks of investing in VGS ETF?
As with any equity investment, VGS carries market risk and can fluctuate in value. Additionally, its heavy U.S. weighting and lack of emerging markets exposure concentrate risk. Currency fluctuations also impact international returns.
Does VGS ETF pay dividends?
Yes, VGS pays dividends quarterly from the underlying stocks it holds. The current dividend yield is around 1.8% per year.
How much are the fees for VGS ETF?
VGS has an extremely low management fee of just 0.18% per year, making it one of the cheapest international equity ETFs available.
What is the difference between VGS and VGE?
VGS tracks the MSCI World ex-Australia Index of developed markets, while VGE tracks the FTSE Emerging Markets Index, providing exposure to developing economies.
Is VGS ETF Australian domiciled?
Yes, VGS is issued and traded on the Australian Securities Exchange, making it simple for Australian investors to buy and hold.
What’s the biggest holding in VGS ETF?
Apple is currently the largest single holding in VGS at around 4.5% of the total portfolio weight.
Explore other ETF options in our Shares & ETFs section. Find a wide range of ETFs to suit your investment preferences and goals. You can also check our property investment articles for more opportunities.
References
| Website Name | URL | Description |
|---|---|---|
| Vanguard Australia | https://www.vanguard.com.au | Official site for Vanguard Australia, providing detailed information on VGS ETF, including performance data, holdings, and fees. |
| Australian Securities Exchange (ASX) | https://www.asx.com.au | Offers official listings and data for ETFs traded in Australia, including VGS. |
| Morningstar Australia | https://www.morningstar.com.au | Provides independent analysis, ratings, and research on Australian ETFs, including VGS. |
| ETF Watch | https://www.etfwatch.com.au | Features a database of Australian ETFs with tools to compare and analyze, including VGS ETF. |
| InvestSMART | https://www.investsmart.com.au | Offers fund information, performance data, and expert insights on Australian ETFs like VGS. |
| The Motley Fool Australia | https://www.fool.com.au | Provides investment advice and analysis on Australian ETFs, occasionally covering VGS. |
| Livewire Markets | https://www.livewiremarkets.com | A platform for investment insights and market trends that may include discussions on VGS ETF among other investment options. |
| Financial Review | https://www.afr.com | A leading source of Australian business and finance news, offering analysis that may include VGS ETF and its market movements. |
Share Your Thoughts and Experiences
Share your thoughts, questions, and insights in the comments below.
We’d also love to hear your feedback on this article. Did you find it informative and engaging? Are there any additional topics or aspects of the VGS ETF you’d like us to cover? Your input helps us create even better content for the Aussie investing community.
Remember, investing involves risks, and it’s crucial to conduct your own research and seek professional advice before making any investment decisions. The A ETF may or may not be the right fit for your specific circumstances, but we hope this review has provided you with a comprehensive understanding of this popular Australian ETF.
Happy investing, and stay tuned for more insightful content from our team!
Important Disclaimer: Not a Licensed Financial Advisor
The information and insights provided in this document are intended solely for educational and informational purposes. It’s imperative to understand that I am not a licensed financial advisor, tax expert, or investment strategist. The contents herein are crafted to offer a general overview and should not be construed as personalized financial advice.
Before making any financial decisions or embarking on investment ventures, it’s crucial to consult with a professional financial advisor or a certified tax consultant who is well-equipped to understand your unique financial landscape. Engaging with a licensed professional ensures that the advice you receive is tailored to your specific financial goals, risk tolerance, and tax obligations, adhering to the compliance and guidelines established by regulatory authorities, including the Australian Taxation Office (ATO) and other relevant bodies.
Financial markets are complex and dynamic and involve various degrees of risk. Therefore, thorough due diligence and professional guidance are essential to navigate these waters effectively. This content does not represent the opinions or endorsements of any financial institutions or regulatory agencies. Remember, the responsibility for financial decisions lies with the individual, and seeking qualified advice is the best step towards informed decision-making and achieving financial objectives.

1 thought on “VGS ETF Review: A Closer Look at This Global Equity Fund”